Latest News
ICE sugar broken out of the falling wedge ... bullish trend to begin? or just an abberation to a prolonged consolidation?
| FXsystems | ||
   |
|
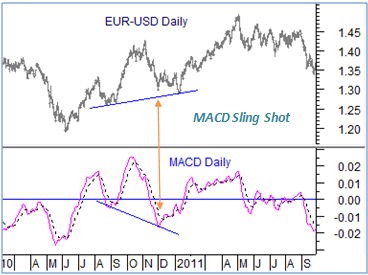
Moving average Convergence and divergence is one of the few indicators which gives reliable signals, but not to get carried away with the fact, the capability of the price trend to move matters more than mere finding of a signal. In one such instance the MACD Bullish sling shot can be an intermediate signal. The frequency of occurance is less, but when used as n intermediate signal.
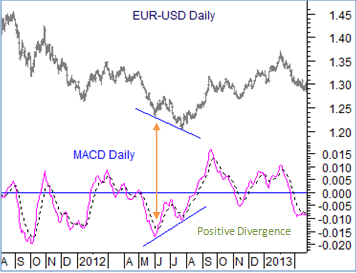
MACD Divergence: The frequency of price divergence with MACD can occur multiple times in a month/quarter but the period of divergence can provide valuable clues of potentials of the trend to unfold. In the chart below the positive divergence of the MACD to price has caused a reversal of the trend to make a new swing high.
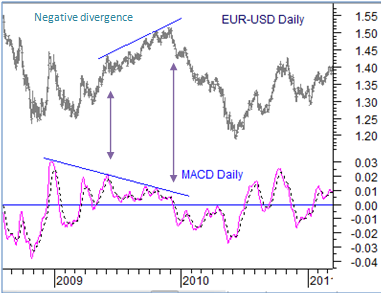
Negative divergence: As mentioned the duration of the divergence of the price trend to MACD indicator ( or any other indicator) causes a greater degree of change in trend than ordinarily seen as corrections. Trading a divergence needs a great patience as the change in trend - is a change in the price trend- not in the indicator. As the case seems here, the system trades based on divergence needs to be entered at an early stages of the trend so as to avoid early corrections to discourage from holding on to the position.
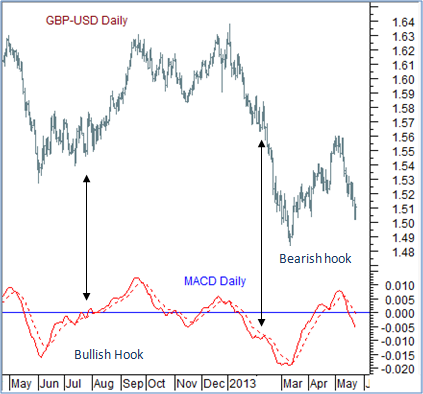
MACD Hook A typical hook in MACD is defined as the signal line rubbing close to the MACD line for few sessions (could be weeks) and follow the prior trend without any change in the trend. The underlying point is that the price trend is consolidating for a while before resuming its prior trend. There is however a thin line of difference trading a hook or an early MACD signal, there has to be few bad trades especially when it is not sure the tide is making a new low or new high.
Trading around the mean involves price action to cross above/below the mean convincingly and consider a trading position. The basic assumption of this approach is price below a mean can be undervalued and price above its mean is overvalued. The over valuation or under valuation would eventually offset by price reverting back to its mean. In a broader way a trader tries to capture a mean reverting tendencies of the price trend and trade an over/under valued price for a particular time frame.
Bollinger bands can be seen as a mean reverting system wherein volatility in form of standard deviations constantly adjust themselves to the market trends. This indicator is plotted on the price trend of a charting software and time frames followed are not limited to 20-Day on daily or 20 on weekly. The basis limitations of any technical signal is its inability to call for a top or a bottom, which is mainly a function of fundamental shifts in market places such as govt policies or a shift in demand/supply equations. Hence even to trade this indicator being early in to the trend is much more critical. Few of the common signals are explained below. Basic signals: Buy : when the price rises above the upper end of the Bollinger bands Exit long: When the price falls below the Median line Sell: When price falls below the lower Bollinger and Exit short: When the price rises above the Median of the Bollinger band.
Impulse Wave confirmation: One of the limitations like any other technical signal is that the Bollinger band signals are seen even at the extended up/down trend. The impulse wave confirmation cautions to ignore the existing uptrend all together and wait for the next set of signals to participate.
Volatility Sqeeze: With the markets consolidating more often, the volatility bands serve as a signal of a rise and fall in volatility and hence price move. A narrow bands show the price trend can consolidate and thereby a spurt of volatility needs to be awaited. As indicated already the indicator is a mean reverting and hence does not signal a major top or a bottom. It is just that a period of low volatility is followed by a period of high volatility.
To decipher the chart above the following points may be worth noting: The sell signal that we saw after price reversed its rally and tested the lower end of the bollinger band could be considered as a first phase of weakness. In between we have had occasional phases of narrow bands which can be treated as a volatility squeeze. That is a period of lower volatility was followed by a period of higher volatility. Finally the impulse wave marked as 1 to 5 indicates a pattern in which a trend matures before making a reversal. Here the weakness in EUR-USD from 1.50 cents to 1.20 cents followed a impulse wave down, where the price trend after falling to 1.20 cents had seen a characteristics of an impulse wave down or in other words the weakness from 1.50 could be maturing close to 1.20. Hence the sell signals if seen any at this phase of the trend is to be taken like "a pinch of salt". As the basic limitations of technical signals is that we do get some signal or the other at the market top and bottoms. Hence after an extended move, looking for an impulse wave up/down can help discriminate going long at tops or going short at bottoms.
|
| Last Updated on Monday, 01 July 2013 13:03 |


- Bank Rates
| Currency | Centeral Bank Rate | Overright Rate |
 AUD AUD |
2.75% | |
 NZD NZD |
2.50% | |
 EUR EUR |
0.50% | 0.45% |
 CAD CAD |
1.00% | |
 GBP GBP |
0.50% | 0.48% |
 USD USD |
0.25% | 0.12% |
- Economic Calender
| Date | Event | Actual | Forecast |
|
Jul 30
|
USA Cons Confidence |
81.40 | |
|
Jul 31
|
USA Adv GDP Q/Q | 1.8% | |
|
Aug 02
|
USA NFP | 195K |
Free Newsletter